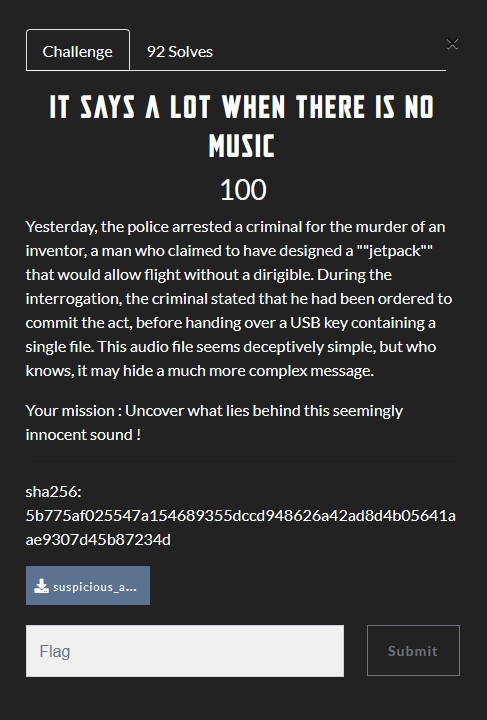
We need to analyze a suspicious .wav audio file that contains a hidden message. The challenge title, “It says a lot when there is no music”, suggests that the solution might lie in the absence of sound, which points directly to analyzing the silent parts of the file, especially at the beginning and the end. The puzzle involves uncovering a hidden message by decoding a sequence of numbers derived from the audio data.
An audio analysis tool (for example, Audacity or Sonic Visualiser) could be used to visualize the track’s content, but the approach here is to manipulate the data directly with Python.
1. Importing and Preparing the Audio File
To read the .wav file in Python, we use the scipy.io.wavfile library. This library allows us to easily load an audio file into a numeric array.
Here’s an overview of the procedure:
import matplotlib.pyplot as plt
from scipy.io import wavfile
Loading the wav file
filename = “suspicious_audio.wav”
sample_rate, data = wavfile.read(filename)
- sample_rate: the sampling rate of the audio file (in Hertz, i.e., the number of samples per second).
- data: an array containing the numerical values of the audio samples. Each sample represents the amplitude of the signal at a specific point in time.
If the file is stereo, we’re only interested in one channel (mono), so we keep only one of the two data columns:
if len(data.shape) > 1:  # If the file is stereo
    data = data[:, 0]    # Use only the first channel
2. Observing the End of the File
After loading the audio data, the next step is to examine the final part of the audio file. At the end of the file, a long sequence of zeros is present, followed by a few numbers.
We extract this sequence from the end of the audio and display it:
data = data[13641006:]
3. Visualizing the Waveform
Once we’ve isolated the part of the audio we’re interested in, we use Matplotlib to plot the waveform of this data sequence. This helps us visualize the signal amplitude over time. If the sequence contains fixed values, such as zeros or constant numbers, this will appear as flat lines or horizontal segments in the graph.
Create a time array for visualization
time = [i / sample_rate for i in range(len(data))]
Plot the waveform
plt.figure(figsize=(10, 6))
plt.plot(time, data, label="Audio Signal")
plt.title("Waveform of " + filename)
plt.xlabel("Time (seconds)")
plt.ylabel("Amplitude")
plt.legend()
plt.grid()
Save the plot as a PNG file
output_file = "waveform_plot.png"
plt.savefig(output_file)
print(f"Plot saved as {output_file}")
By analyzing this waveform, we can observe that the data at the end consists mostly of zeros (no sound), but a few variations (non-zero numbers) appear at the very end. These numbers are crucial for the next step.
4. Extracting Hidden Numbers
The few numbers that appear at the end of the audio file are important — they probably encode a message. The idea here is to take those numbers, convert them into ASCII characters, and form a readable message.
To extract those numbers and convert them into text, we can either use a tool like dCode or write a simple Python script:
Extract the interesting numbers at the end
numbers = data[-10:] # Last 10 samples (adjust based on your data)
Convert these numbers into ASCII characters
message = ''.join([chr(int(num)) for num in numbers])
print("Hidden message:", message)
The extracted values may correspond to text that is the flag of the challenge.
5. Full Script
import matplotlib.pyplot as plt
from scipy.io import wavfile

# Read the .wav file
filename = 'C:/Users/Melanie/Downloads/suspicious_audio(1).wav'
sample_rate, data = wavfile.read(filename)

# Check if the file is stereo or mono
if len(data.shape) > 1:  # Stereo
    data = data[:, 0]  # Keep only the first channel (mono)

# Create a time array
print(len(data))
data = data[13641006:]
duration = len(data) / sample_rate
time = [i / sample_rate for i in range(len(data))]
print(data)

# Plot the waveform
plt.figure(figsize=(10, 6))
plt.plot(time, data, label="Audio Signal")
plt.title("Waveform of " + filename)
plt.xlabel("Time (seconds)")
plt.ylabel("Amplitude")
plt.legend()
plt.grid()

# Save the plot to a file
output_file = "waveform_plot.png"
plt.savefig(output_file)
print(f"Plot saved as {output_file}")
Output:
13641806
[  0   0   0   0   0   0   0   0   0   0 ...  72  65  67  75  68  65  89 123  77  97 115 116 51 114  95  48 102  95
  87  52 118  40 101 115 41 125]
Then we convert to ASCII:
# List of ASCII codes
ascii_codes = [
    34, 65, 32, 108, 111, 116, 32, 119, 104, 101, 110, 32, 116, 104, 101, 114,
    101, 32, 105, 115, 32, 110, 111, 32, 109, 117, 115, 105, 99, 34, 46, 32, 72, 101,
    114, 101, 32, 105, 115, 32, 121, 111, 117, 114, 32, 102, 108, 97, 103, 32, 58, 32,
    72, 65, 67, 75, 68, 65, 89, 123, 77, 97, 115, 116, 51, 114, 95, 48, 102, 95,
    87, 52, 118, 40, 101, 115, 41, 125
]

# Convert to ASCII characters
message = ''.join([chr(code) for code in ascii_codes])

# Display the message
print("Decoded message:")
print(message)
And we get the flag!
HACKDAY{Mast3r_0f_W4v(Es)}
Test: strings -e b suspicious_audio.wav ?
By Roockbye